A histogram is a bar graph that shows how often values fall within set intervals. It is useful for spotting the shape and spread of a distribution.
Use a histogram to:
- see whether your data follows a normal distribution
- find where values cluster
- determine how spread out the values are
Download histogram template (PDF 976.5 KB)
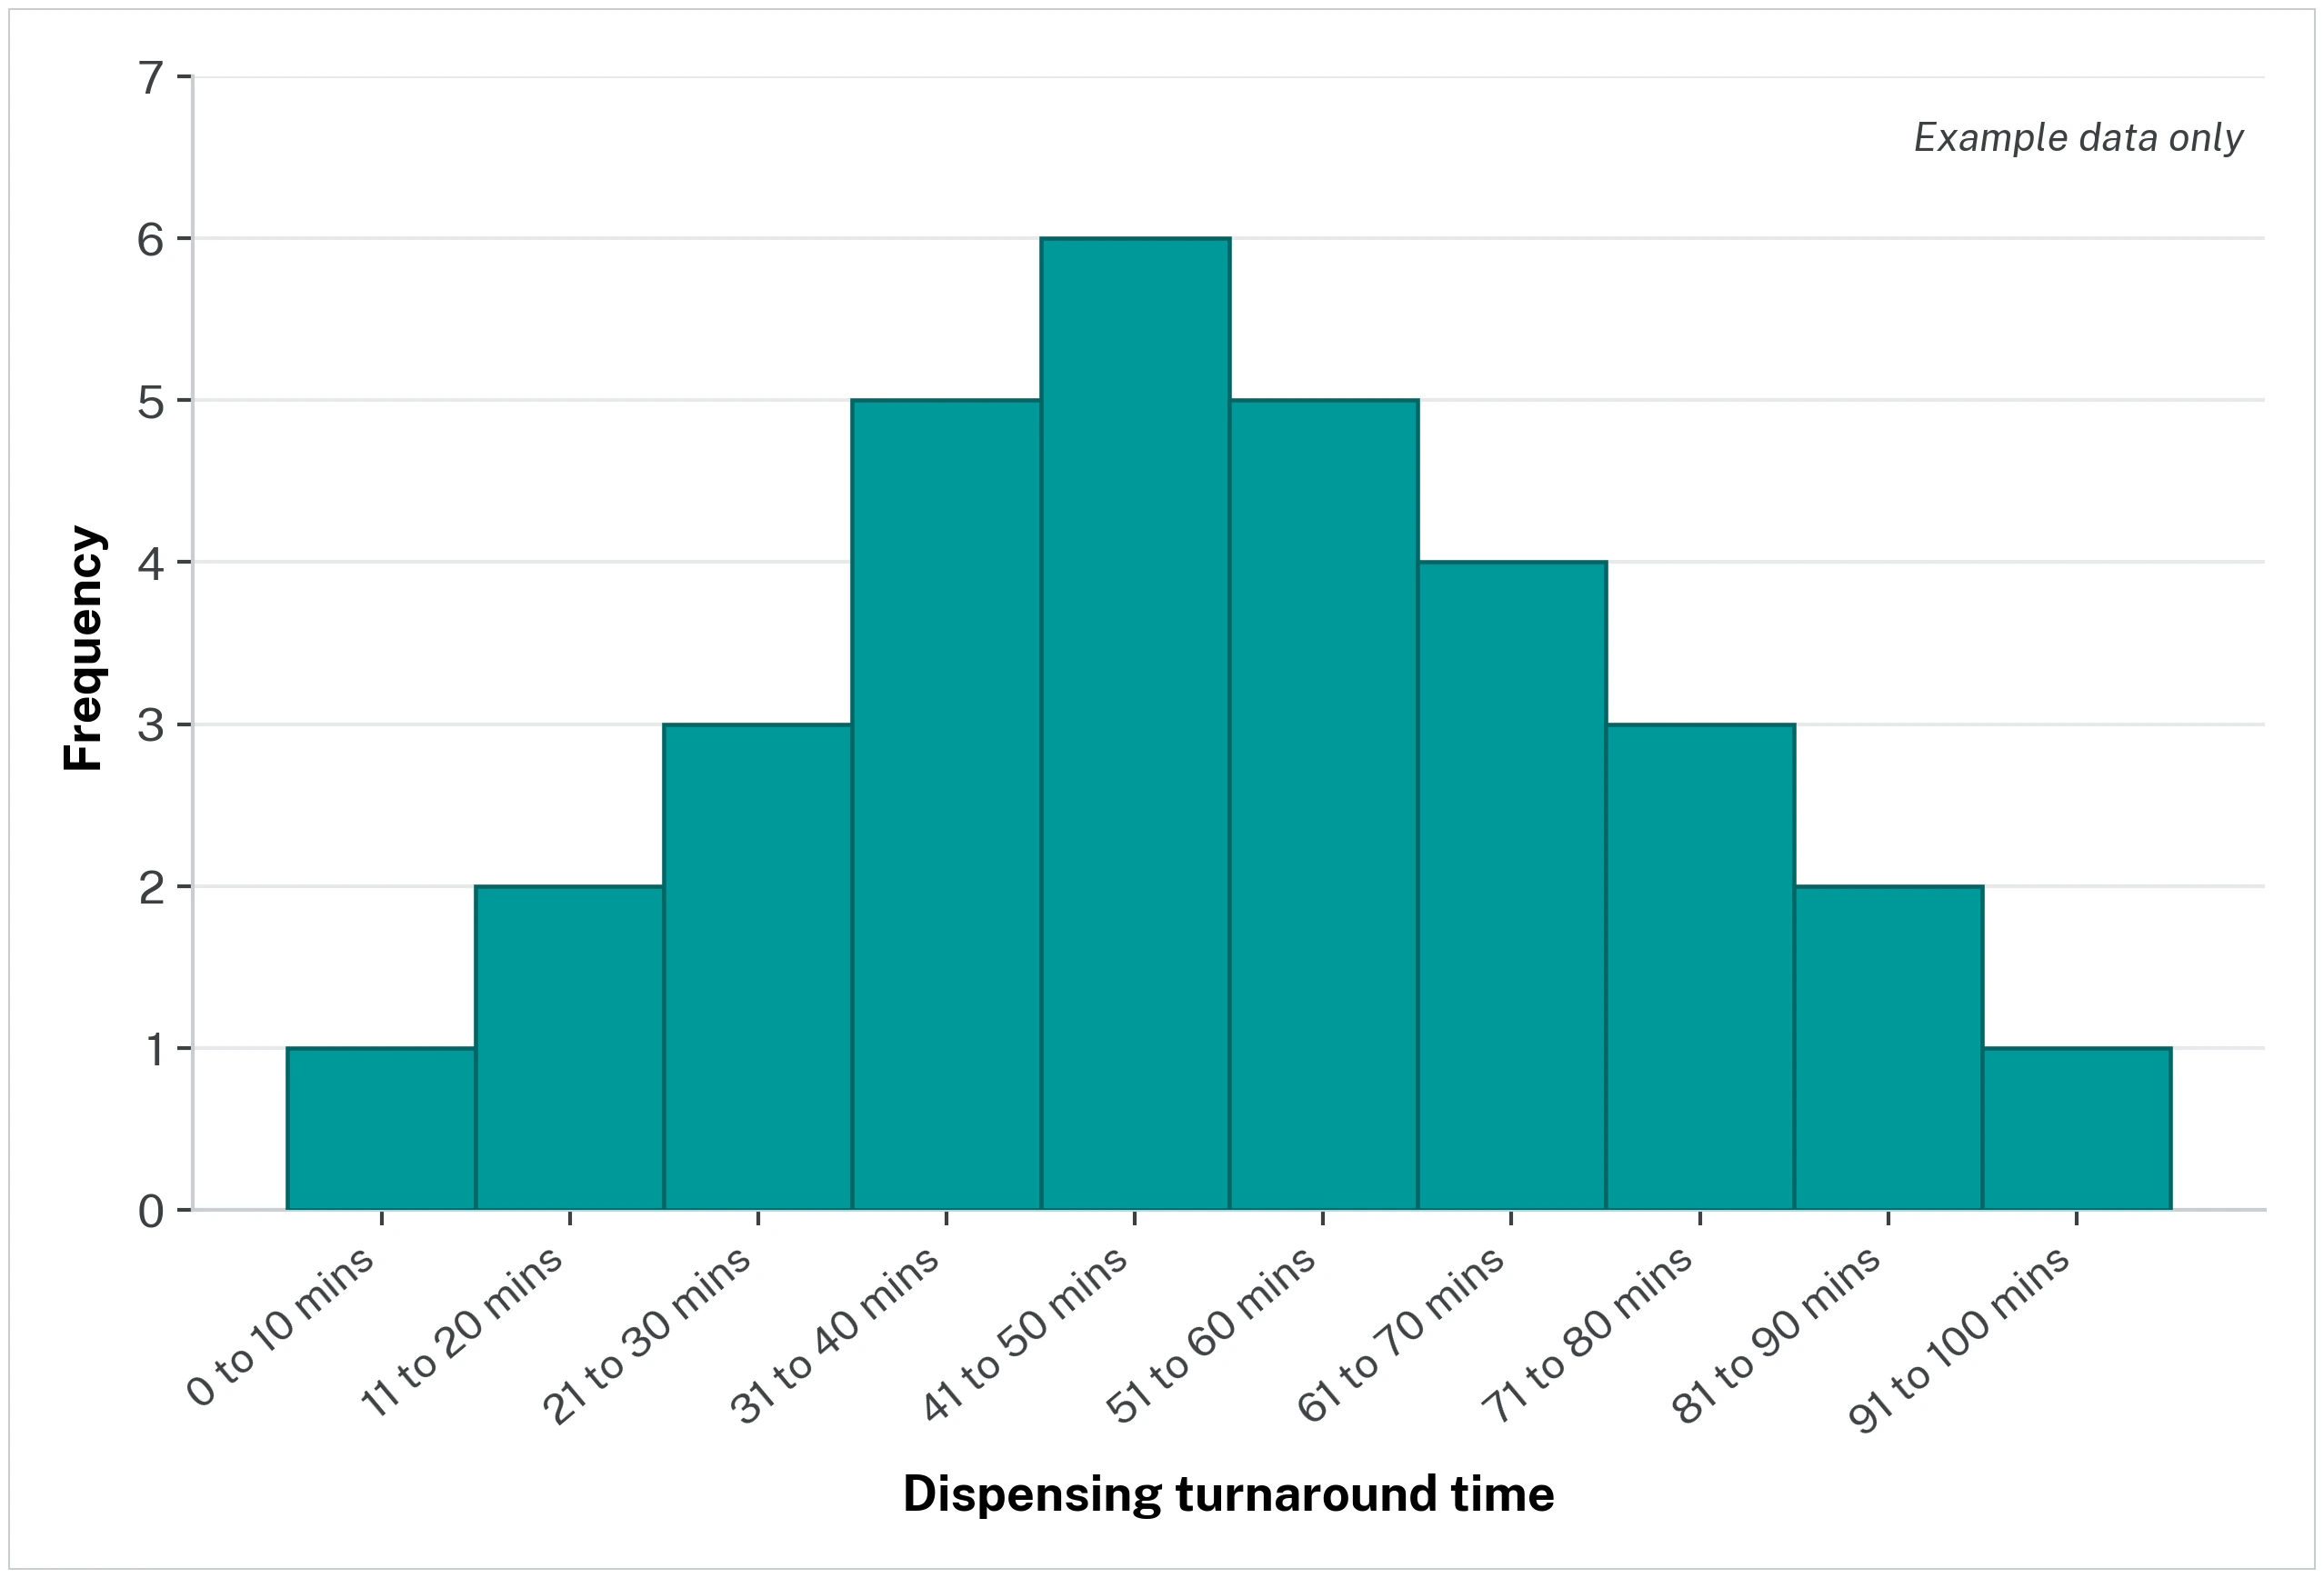
Histogram example
Imagine you collect pharmacy drug dispensing turn-around times for a specific period. If the values follow a normal distribution, some observation times will be very short, and some will be much longer, but most will cluster around an average. Graphing this gives a classic bell-shaped or normal distribution.
Video tutorial
More about histograms (Institute for Healthcare Improvement)