Use this toolkit alongside the improvement science guide for a step-by-step explanation and the tools you need at each stage.
This page provides information, resources and quality improvement (QI) tools for staff to use to improve comprehensive care processes in NSW health facilities. Adapt these resources to suit your local needs.
Register to gain access to the Comprehensive Care Minimising Harm Community of Practice in the Improvement project section of the Quality Improvement Data System (QIDS). NSW Health Staff only.
Getting started
Set a realistic timeline before you start. Lasting change usually takes 12 to 18 months to test and embed. Expect less time if you’re building on earlier improvement work, or more if the change is complex or spans multiple services.
Start by identifying a specific issue or problem at your facility. Common examples include:
- increasing or high falls rate, delirium rate or pressure injury rate on a ward
- no support for safe mobilisation and prolonged bed rest
- safety huddles aren't being completed on our ward
- intentional rounding isn't being completed reliably
- patient risk factors are not being consistently identified, managed, and communicated.
At this stage, name the problem only. Do not propose solutions yet.
Seek guidance from your clinical governance unit who can connect you with local quality improvement experts. You can also contact colleagues from other health services to learn about their approach to improvement work as well as reaching out to the Systems Safety Improvement team at CEC-OPPSP@health.nsw.gov.au.
Improvement projects need a problem that people are motivated to solve. Common errors at this stage include:
- selecting a problem no one is interested in
- jumping to a solution before investigating the problem
- focusing on a process that is currently unstable, for example a paper-to-electronic transition
- choosing a problem outside your team's sphere of influence.
Assess your unit's readiness for change by reviewing existing culture, sponsorship, communication, team practices and safety and quality concerns. If significant resistance is identified, explore and address the underlying causes before proceeding. In your assessment, consider level of change fatigue noting other projects or events occurring at the time that may impact the availability of staff to support this work.
Gather local data to support the problem you have identified using sources such as:
- data from your incident management system (ims+), Quality Improvement Data System, serious adverse event reports
- a baseline audit using our comprehensive care audit tool
- a literature search of peer-reviewed and grey literature
- staff and patient stories: qualitative insight that complements your data.
The improvement project brief sets out the problem, why it matters, what are the risks of not addressing it, how long the work will take and the approach you will use. A strong brief is grounded in your data, takes sustainability into account, and aligns with your health service's priorities.
Use the improvement project brief to gain a project sponsor early. Present your case for change and ask them to support the work and what this support will look like.
A good sponsor:
- has authority to approve changes
- secures/makes available the resources the team needs
- helps remove barriers as they arise
- holds a senior role but does not work directly on the project
- believes the problem is worth solving.
Communicate closely with your sponsor and provide regular project updates. Your project sponsor can guide where the governance for your improvement project sits within your health service. Project reporting and feedback can be integrated with existing operations such as:
- unit or ward level: staff meetings, ward display boards, quality boards e.g. xx days since last fall.
- facility level: healthcare quality committee meeting or reports.
- health service, local health district or speciality health network level: comprehensive care or safety and quality committees.
The project team's role is to:
- evaluate current processes
- identify and enlist clinical champions
- set general goals
- develop, run and evaluate improvement strategies
- share results and findings.
The project team should consist of:
- a team leader: the voice of the project, runs meetings and coordinates the work
- a quality improvement advisor or expert
- a representative from each discipline that are part of the patient journey or process that the project will be improving. Where possible include a consumer representative. Interviews or surveys may be used to capture consumer perspectives for the project when it is not possible for them to be a member of the team.
Consider inviting colleagues likely to challenge the project. They often raise barriers and perspectives that strengthen the work.
Once the team is in place, define what is in and out of scope for the project. Without a well-defined scope, projects may grow beyond what is achievable, lose focus, and fail.
Patient stories and lived experiences
The lived experience of both patient/consumers and staff can show why change matters in a way that data cannot. The stories below show how care can fall short, and how things could have gone differently. Use them or local patient and staff experiences to open conversations with your team and build your case for change.
Making improvements
This stage involves writing an aim, mapping the current process, generating change ideas, and testing them in Plan Do Study Act (PDSA) cycles.
Your aim statement captures the goal of the project. It must address the problem and must not include a solution.
Your project aim must be SMART. A SMART aim is specific, measurable, achievable, relevant and time bound. Remember:
- "some" or "better" is not a measure, and "soon" is not a time frame
- start small. Focus on a single unit or ward, even if the problem is widespread. Refining your approach on one unit gives you the evidence and confidence to spread the work
- avoid aim statements that suggest the desired solution, for example "implement a specific policy or process on your ward".
Examples:
- Reduce the rate of falls per 1000 occupied bed days on ward 1A by December 20XX .
- Reduce the rate of hospital acquired pressure injuries by 50% for patients at Hospital A by January 20XX.
Develop a process map (also known as flow charts) of your current practice with your team. Map each step and decision in the process. The process map needs to reflect the current process, how it happens in practice, rather than the ideal or intended process.
Use it to identify:
- the full process as it currently operates in practice with defined start and finish point a current roles and responsibilities at each step
- time-critical points, gaps, bottlenecks and variations
- where data may need to be collected to demonstrate reliability.
Refer to your process map and identify any potential gaps, inconsistencies and issues with the current process. Validate the process by tracing a patient’s journey through it and confirming with all multidisciplinary team members that the documented process accurately reflects what is happening in practice.
More about flow charts (process maps)
A meeting with ward staff is used to present and review relevant data to build a shared understanding of the problem. For example, if examining why falls are occurring, data may be presented on the timing of falls, their location, and associated contributing factors such as patients mobilising to the toilet. The team is then encouraged to interpret the data together and brainstorm potential underlying causes and patterns, drawing on their clinical experience and local knowledge to identify what may be driving the results.
Brainstorming with frontline staff will give you a better understanding of the problem you are aiming to solve. Without understanding all the causes of a problem, the solutions you generate may not actually lead to an improvement because they are focused on the wrong part of the process, allowing the problem to continue. Be as specific as possible when brainstorming. For example:
- patient mealtimes clash with staff mealtimes and/or medication rounds
- handover being conducted at high demand periods when patients need toileting
- patients don't ring the call bell early enough when they need to go to the toilet
- lack of knowledge of delirium
- patients aren't involved in their care planning
- staff feel intentional rounding increases workload.
Sort the causes from your brainstorming into themes using the affinity diagram. Assign category headings for each theme.
A driver diagram translates the themes identified through an affinity diagram into primary and secondary drivers that explain the system factors influencing the outcome and guide targeted interventions. The category headings become primary drivers. The causes of the problem under each heading are your secondary drivers. A driver diagram is a visual tool that illustrates the relationship between the aim of the improvement project, the primary drivers (themed category headings) and the secondary drivers (causes of the problem).
Primary drivers are high-level factors that need to be influenced to achieve the aim.
Secondary drivers are specific factors or interventions that are necessary to achieve the primary drivers. Each secondary driver will contribute to at least one primary driver, shown via relationship arrows.
Resources
Solutions in quality improvement are commonly referred to as change ideas or change concepts. Change ideas are well defined change concepts or interventions to address the secondary drivers, that is, what exactly are you going to do and how will this be achieve. Use the driver diagram to brainstorm change ideas for each secondary driver. Not all changes lead to improvement, and this is why testing on a small scale first and monitoring the impact is important as opposed to implementing widely. For each change idea, consider:
- will it be easy or hard to implement? (consider the cost involved, time involved, extent of training required)
- what impact will it have on achieving the aim?
- feasibility and time requirements, such as how the change will be done (that is, the logistics) and the expected outcomes of each change idea.
- does it impact more than one secondary driver?
Hard-to-implement changes should not automatically be deprioritised. Some of the hardest changes lead to the biggest improvements.
To determine if the change ideas lead to an improvement, they each need to be tested on a small-scale using Plan, Do, Study, Act (PDSA). Start with one patient, one shift or one team. If the test works, expand (for example, three patients, three shifts, three teams), then continue scaling up.
PDSA cycles are designed to be rapid and sequential. Implementation only happens once small-scale tests achieve a reliable improvement.
Example PDSA – testing a post fall huddle process
Example 1:
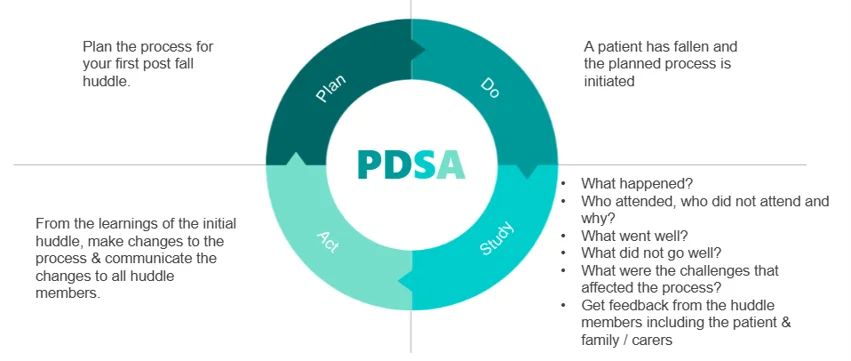
Example 2:
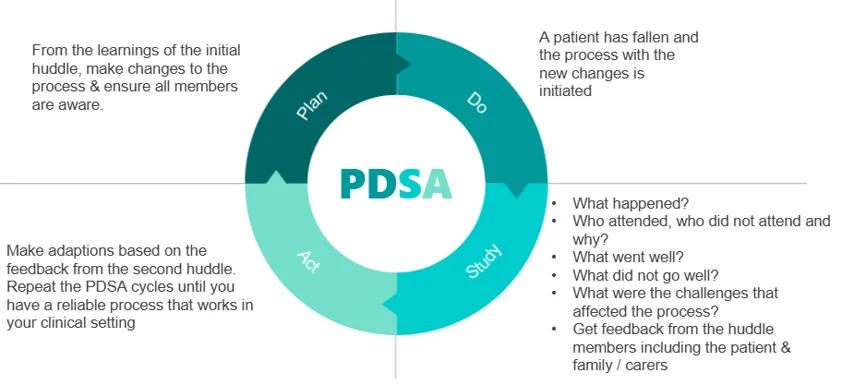
Tips for PDSA cycles:
- PDSA cycles are not designed to be time consuming, and can be performed rapidly and in a staggered approach.
- Test no more than three change ideas at a time.
- Monitor your measures continuously (see data for improvement).
- Briefly document each cycle through all four stages.
- Determine which changes (or combination of change ideas) are leading to an improvement and achieving the aim.
Data for improvement
When testing your change ideas with PDSA cycles, you need to start collecting data to be able to determine if the changes made has resulted in an improvement. This data will be collected in 'real time' rather than retrospectively. It is likely most of this data will be quantitative but qualitative data can be equally valuable.
Create a family of measures
A single measure is not enough to determine whether improvement has happened. It is important to define the numerator and denominator and provide an operational definition for each measure to ensure data consistency.
Outcome measures are closely aligned with your aim statement or the overall impact you are trying to achieve. They outline how the overall process or system is performing.
Examples:
SMART aim: 50% reduction in rate falls/1000 occupied bed days on Ward 1A by December 20XX.
Outcome measure: Rate of falls per 1000 occupied bed days, for example:
- Numerator: Number of falls
- Denominator: Number of occupied bed days of all Ward 1A separations.
Process measures are informed by your primary and secondary drivers. They are measures of the impact of the PDSA cycles.
Examples:
- Primary driver: Safe and early mobilisation.
- Secondary driver: Patients eating lunch in bed.
- Process measure: % of patients sitting out of bed for meals.
Balancing measures: Monitor for unintended consequences of the change that can have either positive or negative pact to the system.
Examples:
- Change idea: Sitting patients out for lunch.
- Balance measure: % patients receiving delayed lunchtime medications.
Before collecting data:
- review existing baseline or historical data on the process you are improving
- collect baseline data for your chosen measures if not already available
- agree as a team on who, when, where and how data will be collected
- find the most efficient way to collect the data
- assign individual team members responsibility for each measure
- record data in QIDS (preferred) or a shared spreadsheet
- speak with staff and patients while testing to hear about their experience
- continue collecting data after the project to confirm gains are sustained.
Determine how much data to collect
Data for improvement is about, ensuring that you collect ‘just enough’ data (not too much or too little) to inform if changes have led to an improvement. A sample which is too small may not capture the effects of the change; conversely, a large data collection may not be possible or sustainable due to time or resource constraints.
As a minimum, collect 5 to 10 data points each data collection period (day, week or month depending on frequency of what is being measured) (for example, 5 to 10 patients). Collect either consecutive cases or a random sample. Adjust based on the size of your service and the frequency of the problem.
People who can help with some of the data collection include health information data, local clinical governance or patient safety and medical records teams.
Once data is collected, your team needs to interpret it to see if improvement has happened. Enter data into a spreadsheet or use QIDS. QIDS builds charts using your data.
Run charts are line graphs showing data over time. They are an effective way to tell the project story and communicate progress to stakeholders. Annotate run charts to show when each change idea was tested and how it may have driven improvement. Your local quality improvement advisor can help with displaying and analysing data.
To know if an improvement is real and lasting, look at patterns in your data over time. Probability-based rules help separate genuine change from random variation. On a run chart, for example, six consecutive data points above 95% signal a reliable improvement. This means the new process is followed 95% of the time.
See safety intelligence data tools for more options to present data. Once the change idea (or combination of ideas) is producing reliable improvement, begin your project evaluation.
Communicating change
Different project stakeholders may require different communication approaches tailored to individual needs, motivations and preferences. Use a stakeholder engagement plan (PDF 25.9 KB) to tailor how you will communicate with each stakeholder. It specifies the frequency, type and content of communications to build and maintain engagement at every level.
- Use hospital wide communication channels, such as a newsletter or intranet.
- Support local nursing, medical or pharmacy champions to advocate for improvement.
- Create a ward display board or face-sheet handout with project data.
- Set a standing agenda item or short presentation at regular meetings.
- Use double-staffing time or staff meetings for short, regular updates.
- Create posters, lanyards and computer screensavers.
- Hold a project launch or workshop, or integrating engagement into existing events (medication safety forums, Grand Rounds).
- Run a quiz, create social media posts or send email updates.
- Distribute information to general practice visiting medical officers in rural and regional areas.
Providing education
Developing and delivering education is a fundamental component to ensuring project success. Education and training will need to be delivered to a variety of stakeholder groups at numerous points throughout the project lifecycle.
- Open with an interactive poll or pre- and post-quiz to check perception and knowledge change.
- Include a recent patient story from your health service to build engagement.
- Invite a well-respected local champion to speak to the targeted unit or ward.
- Keep sessions short and frequent; plan coverage for staff working after hours or on weekends.
- Collect attendance records and post-session feedback to improve future sessions.
- Share planning and delivery across the team, so no one person has to do it all.
Sustain and spread
Once a change has produced a measurable improvement, the final step is to embed it into everyday practice and spread it across the service.
Develop a sustainability plan early, not at the end of the project. Involve your quality improvement advisor.
Embedding improvement into practice usually involves:
- standardisation: work processes, roles and responsibilities, documentation
- education: built into routine training for all staff
- ongoing measurement: data collected and reviewed regularly.
Sustain improvement over time
Embed data collection into standard practice in your ward or health service. Include staff and patient stories and other feedback to track sustainability.
Once testing ends, you can collect data less often. For example, move from monthly to three-monthly collection, then to six-monthly. Make sure your project sponsor, health service executive or senior management can see this data.
If the improvement is not sustained
If compliance drops at any point, step back in. You may need to resume more frequent measurement to understand why and repeat your PDSA cycles to get the change back on track.
Spreading means actively rolling the change out to other wards, units, services or facilities. What works in one setting may not work in another, so revisit the improvement process and adapt for the local context.
The Institute for Healthcare Improvement’s seven spreadly sins (PDF 424.9 KB) sets out practical pitfalls to avoid.
Once an improvement is sustained and spread, it is the responsibility of the health service governance unit or team for ongoing monitoring. Build measures into your performance indicators and complete audits at a frequency determined locally.
As technology evolves, revisit the process to make sure improvements remain embedded.