A flow chart shows the steps in a process visually; in the order they happen. Use one early in a quality improvement project. It shows how a process runs, where steps overlap and where things go wrong.
How to use a flow chart
Start with a high-level flow that shows the main stages of the process. Then build a more detailed version that maps every step a patient or staff member takes.
The clearest way to draft a flow chart is together as a team, on a whiteboard or with sticky notes. People who do the work each day often see steps that managers miss.
Download flow chart template (PPT 80.2 KB)
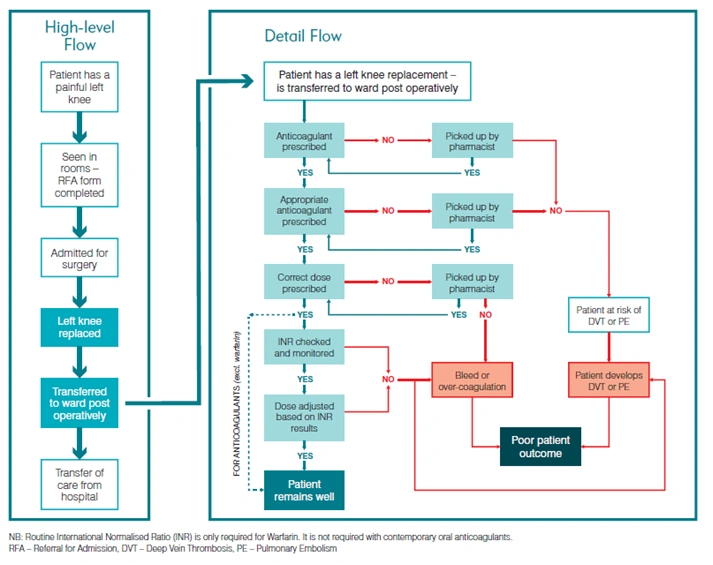
Example: patient on anticoagulants
Follow the patient journey from the first surgical consult, through admission and surgery, to post-operative care. Map each handover, decision and check. Differences between the documented process and what actually happens are often where risk sits.
Environmental impact
You can also note the resources used at each step, such as single-use items, paper records, transport or energy. This helps your team spot improvements that reduce environmental impact and flag any unintended consequences for the environment.